Are you looking for a way to organize A/B Split Test Results? Look no further!
As a business owner, you probably have a million things on your mind at any given moment. That’s why we firmly believe that documentation is essential for the health and longevity of your business.
One of the most important things you can do as a business owner is to start testing things in your business to make improvements. In this walkthrough, we’re showing you how to create a template (regardless of your tool of choice) to have a centralized place to store your test results.
Let’s dive in!

Not a video person? No problem! We’ll cover all the main points in this article.
Use data to answer business questions
How do we know what actually works in our business?
The existential answer might be, “We’ll never truly know.” However, we can get closer to knowing things in our business if we take the opportunity to start testing.
The idea is that when we have a question in our business, we should look at data or start collecting data by conducting experiments to make informed decisions.
The most common form of testing is A/B Testing. This form of testing is considered entry-level and is an excellent way to break into the world of testing and experiments.
To watch this explanation in video format, watch the video at the top of this article at timestamp 00:00.
What is an A/B test, split test, or single variable test?
A/B Split Testing goes by many names, including Split Testing and Single Variable Testing.
But what the heck is it?
These tests are very similar to what we learned in science class back in the day. We were taught to create a hypothesis and test against it.
With A/B Split Testing, we want to take a situation and divide ourselves into two groups. We want to give both our groups our standard stuff with the exception of changing only one thing in the second group.
This “one thing” is our variable (hence the name Single Variable Testing).
We’re looking for a difference in one specific measure, which we want to identify at the start of the experiment.
To watch this explanation in video format, watch the video at the top of this article at timestamp 00:33.
Example A/B Split Test (with a Newsletter Subject Line)
Let’s say we want to do an experiment around email subject lines.
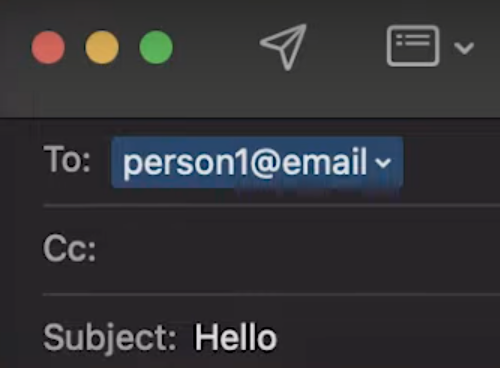
For the first group, we will send a simple email with the subject line, “Hello”
The second group will receive the exact same email and subject line with the exception of an emoji added to the subject line, “Hello 👋”
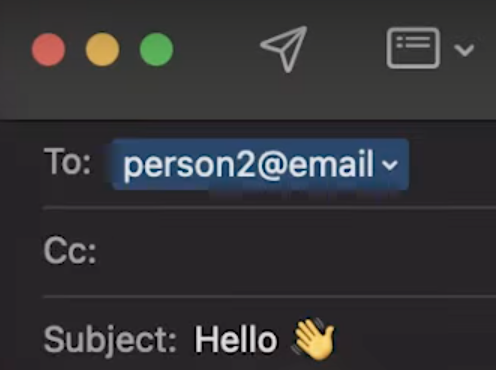
Our goal is to test if having that emoji in the subject line will increase open rates.
What we’re testing for = the impact of emojis in subject lines
What we’re looking at = the open rate of each email
That’s A/B Split Testing in a nutshell. Whether we’re going super scientific with our experiments or keeping things very simple and only testing for minor things with little data, we need a place to store all of this data.
Once we start testing, we’ll never want to stop since the data we’re getting is so valuable. That’s why it’s imperative that we have a centralized place to store our data.
To watch this explanation in video format, watch the video at the top of this article at timestamp 01:34.
Are you ready to push past the ClickUp basics and start systemizing your business? Maybe it’s time you join the ProcessDriven Membership!
ClickUp template example for Split Test Tracking
As a result of all the testing Team ProcessDriven does, we created an A/B Split Test Results Tracking ClickUp Template. It looks like this:
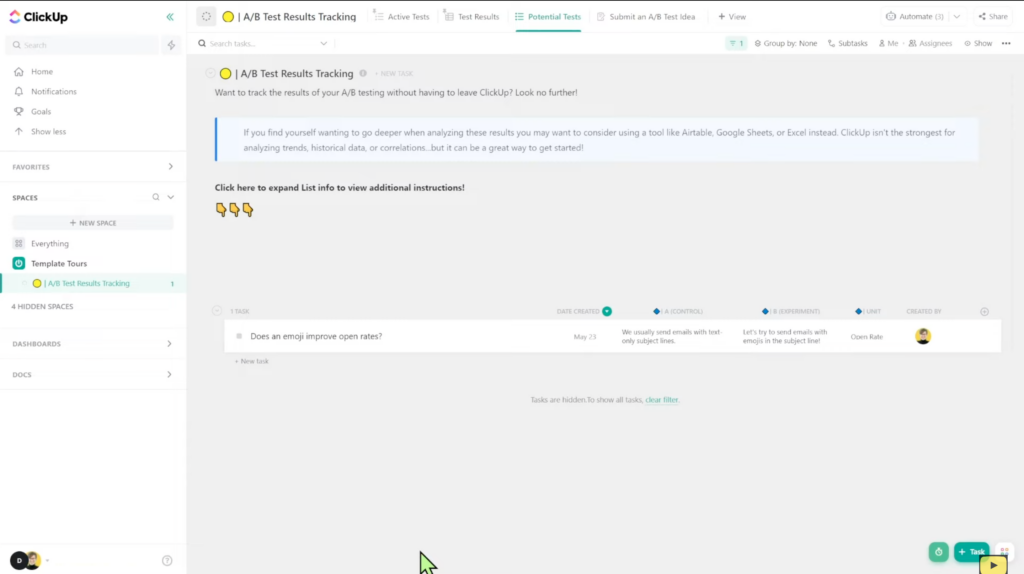
In this template walkthrough, we’ll be highlighting how we use this template to organize our split tests and what quirks to keep in mind when deciding to implement this structure.
First, we created a List in ClickUp titled A/B Split Test Results Tracking. In this List, we have Tasks that represent each test (or each question we’re trying to answer).
In each Task, we have Custom Fields that track data for each test. Here’s an example of what that looks like:
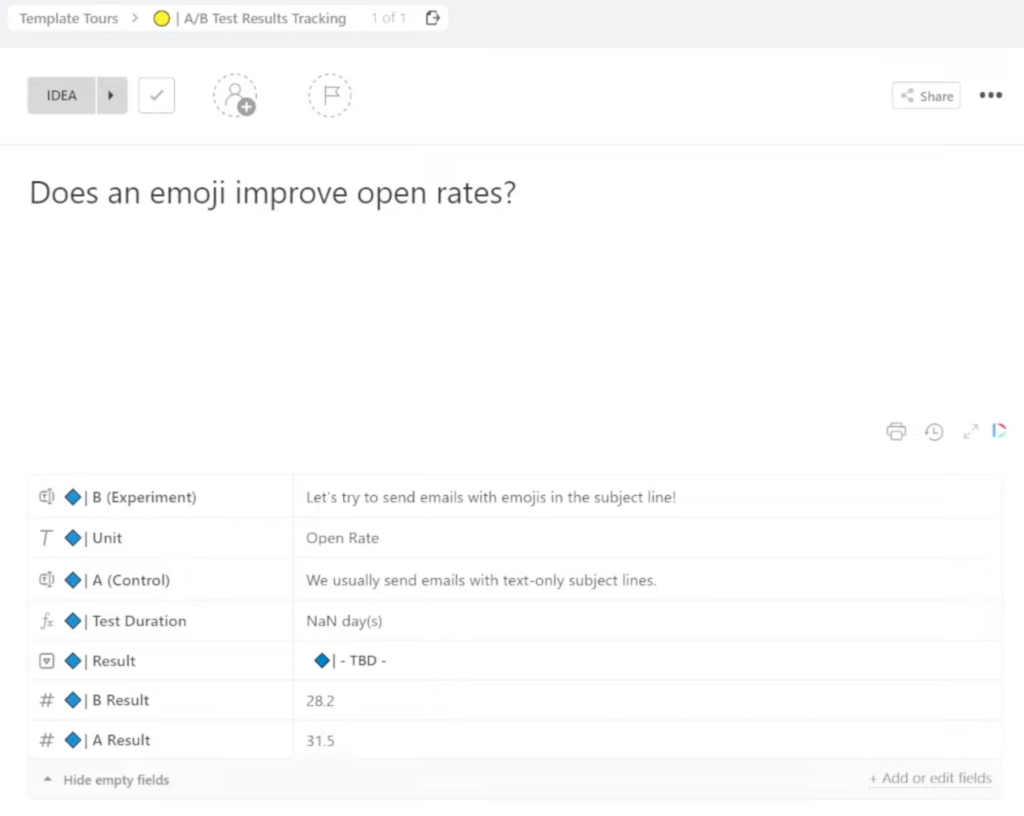
To further expand on each Custom Field:
Task Name = what we’re trying to test
A (Control Group) = the “normal” subject line with text only
B (Experiment Group) = the “test” subject line with an emoji added
Unit = Open Rate
Test Duration = uses the difference between the start date and the due date (automatically calculated in ClickUp)
A Result = used to track the data
B Result = used to track the data
Result = used to track whether or not the “variable” improved or made things worse
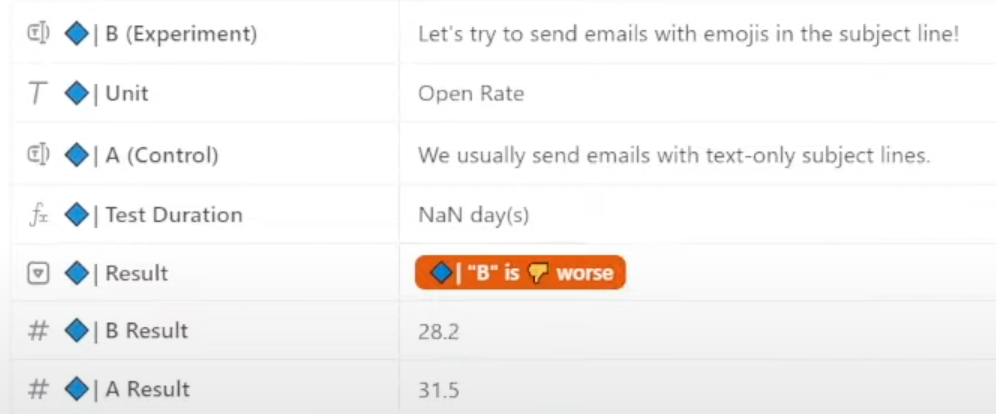
It’s very important that we add our overall result in the Result custom field. We can get super statistical with this data or keep it simple.
Whatever result we choose, filling out this custom field gives us a quick frame of reference when we’re looking at our Test Results and comparing them against each other.

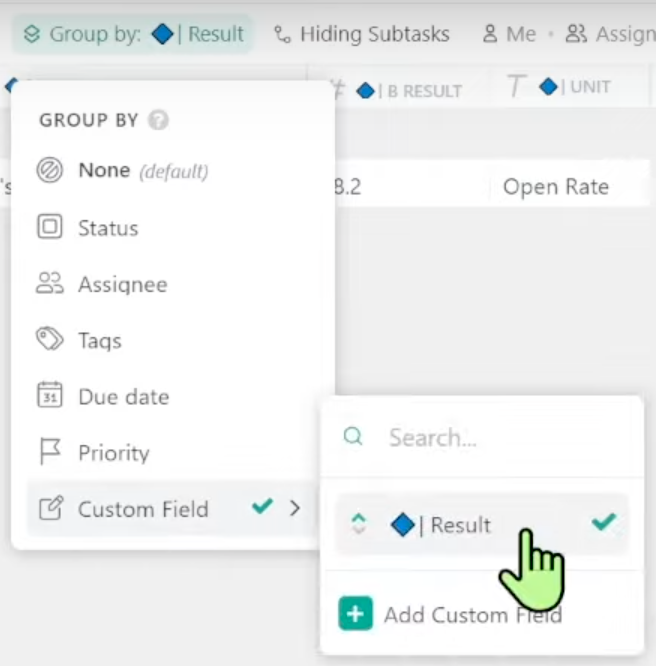
The Test Results in this ClickUp List are set as a Table View. We have our data grouped by the actual result.
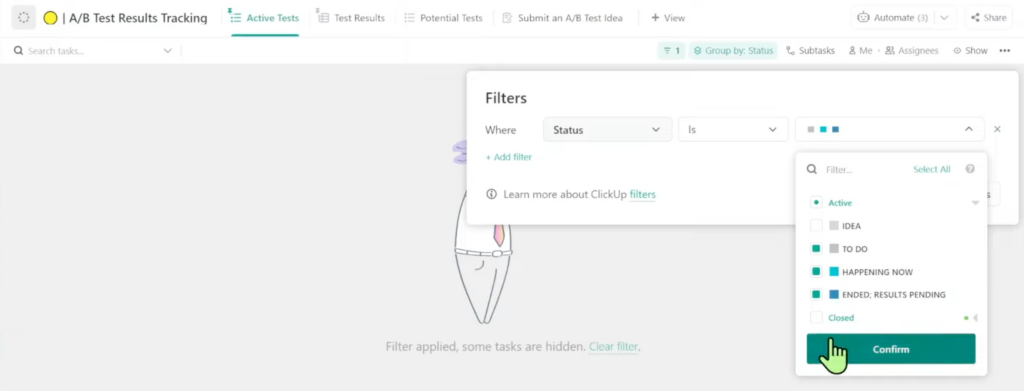
Next up is the Active Tests View. This view shows us any tests that have one of the three active statuses:
The next view we have is the Potential Tests View. This view shows us any tests that are still in the Idea Status.
Our final view is the Submit an A/B Test Idea View. This is a task creation area with a Form View (we’re huge fans of the Form View).
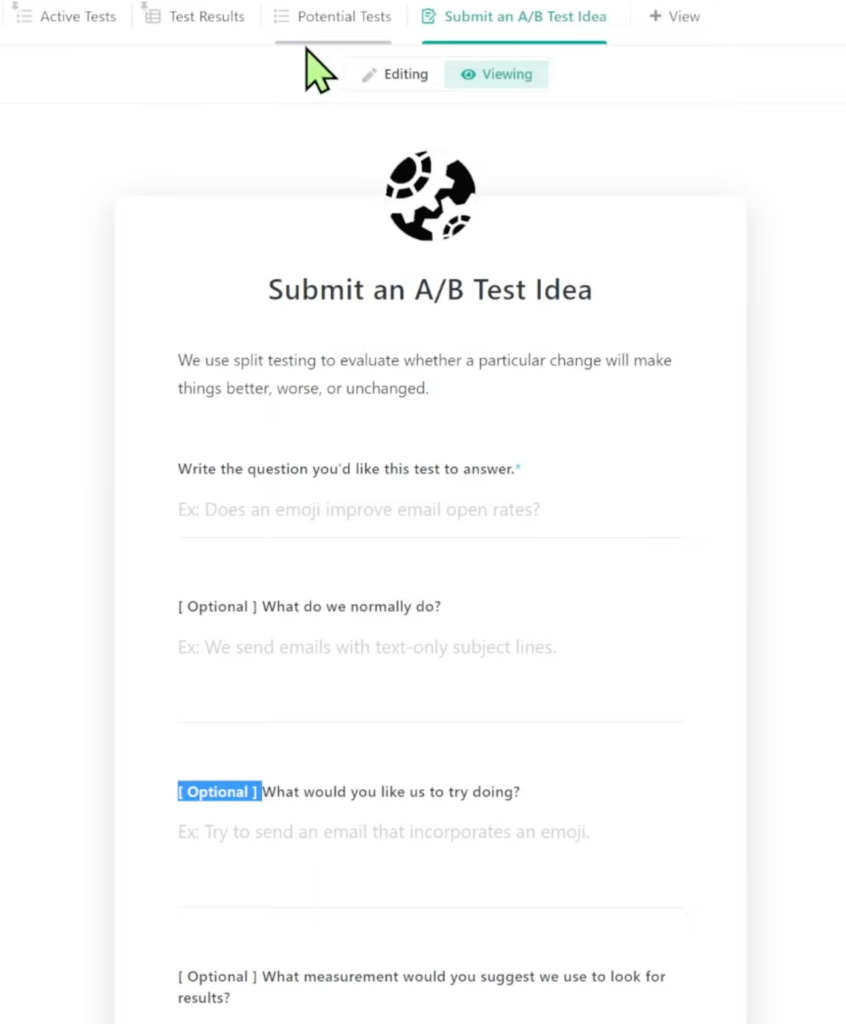
By filling out this form, ClickUp will automatically create a new Potential Task inside this List.
Most ClickUp users use ClickUp Forms with their clients or outside stakeholders, but we believe ClickUp Forms are a great asset to use internally to ensure tasks are created consistently.
We also want to point out that we do not need to use ClickUp to organize A/B Split Test Results. This exact structure can be applied to any tool that allows us to have columns and rows of data. Examples include Microsoft Excel, Asana, Coda, Monday, Notion, etc.
The reason we can replicate this structure in any tool is that we aren’t using any fancy features.
The primary value of this structure is the ability to have all our information in one centralized place, so we don’t have to memorize it.
To watch this explanation in video format, watch the video at the top of this article at timestamp 03:13.
Members can install this resource at be.processdriven.co/resources
We want to remind our ProcessDriven members that they can log in to their accounts and install this A/B Split Test Results Tracking ClickUp Template. It only takes a few seconds!
To watch this explanation in video format, watch the video at the top of this article at timestamp 09:03.
Pro Tip #1: This is for single variable testing only!
Keep in mind that this template is designed to compare one result to another. This could be an A/B Split Test, where we make one change to two otherwise identical things.
It could also be an A/A Test, where we compare two subsets with no changes to ensure our subsets are solid.
However, please keep in mind that this structure will not work for multivariate testing.
If we want to conduct multivariate testing, we’ll need to expand this template and structure if we’re looking to change multiple things about our test scenario at one time.
For most users, this won’t be an issue.
Pro Tip #2: This is for logging results, not crunching numbers.
Another thing we want to keep in mind is that this structure is simply a record of what happened.
If we wanted to conduct in-depth analyses where we check for statistical significance and other complex data, we would need to do that elsewhere.
This structure is only for simple testing and is intended to log results.
Pro Tip #3: Mention or link these results throughout your processes!
The last thing we want to keep in mind, especially if we’re building this structure out in ClickUp, is that we can link these results to other areas of our ClickUp.
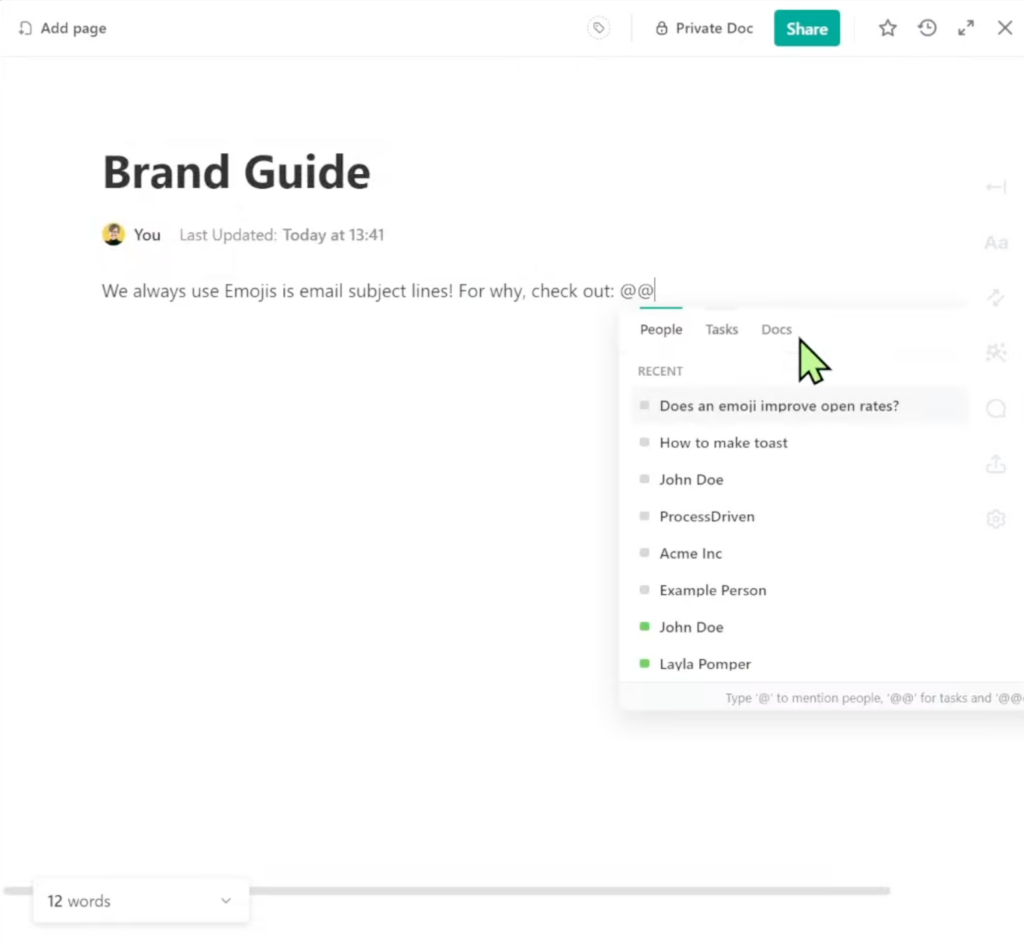
For example, we can mention specific A/B Split Tests in our brand guides, SOPs, tasks, etc. These results can be interwoven in any area of our Workspace for reference.
To watch this explanation in video format, watch the video at the top of this article at timestamp 09:26.
Remember: Human memory is a liability!
When we’re doing anything in our business, whether it’s creating SOPs, executing processes, or organizing A/B Split Tests, we want to remember that our memory is a liability.
If we want to ensure that nothing is ever forgotten, tracking things as we learn them is a great habit to form. This ensures our team learns from any mistakes we previously made.
We hope this ClickUp template tour was helpful. If you’re interested in installing the A/B Split Test Tracking Template, we encourage you to check out the ProcessDriven Membership.
Included in the membership are:
- 45+ ready-to-install ClickUp templates
- An in-depth course to systemize your entire operations in ClickUp (with or without templates)
- Personalized support from Layla and the team to show you exactly how to create your own templates for your specific business needs
- And so much more!
Get all the details right here.
Until next time, enjoy the process!
Are you ready to push past the ClickUp basics and start systemizing your business? Maybe it’s time you join the ProcessDriven Membership!
