
Software Selection & Tutorials
How to Add Widgets to ClickUp Dashboards to Keep Your Team on Track (ClickUp Dashboard Example)
This post may contain affiliate links which may compensate us at no cost to you. See details here.
ClickUp Consultant Layla at ProcessDriven goes over how to build a ClickUp Dashboard example that can help you keep track of how your team is interacting with ClickUp, and how to check your team's unc
ClickUp Consultant Layla at ProcessDriven goes over how to build a ClickUp Dashboard example that can help you keep track of how your team is interacting with ClickUp, and how to check your team's uncleared notifications or overdue tasks (and when it's time for a polite intervention).
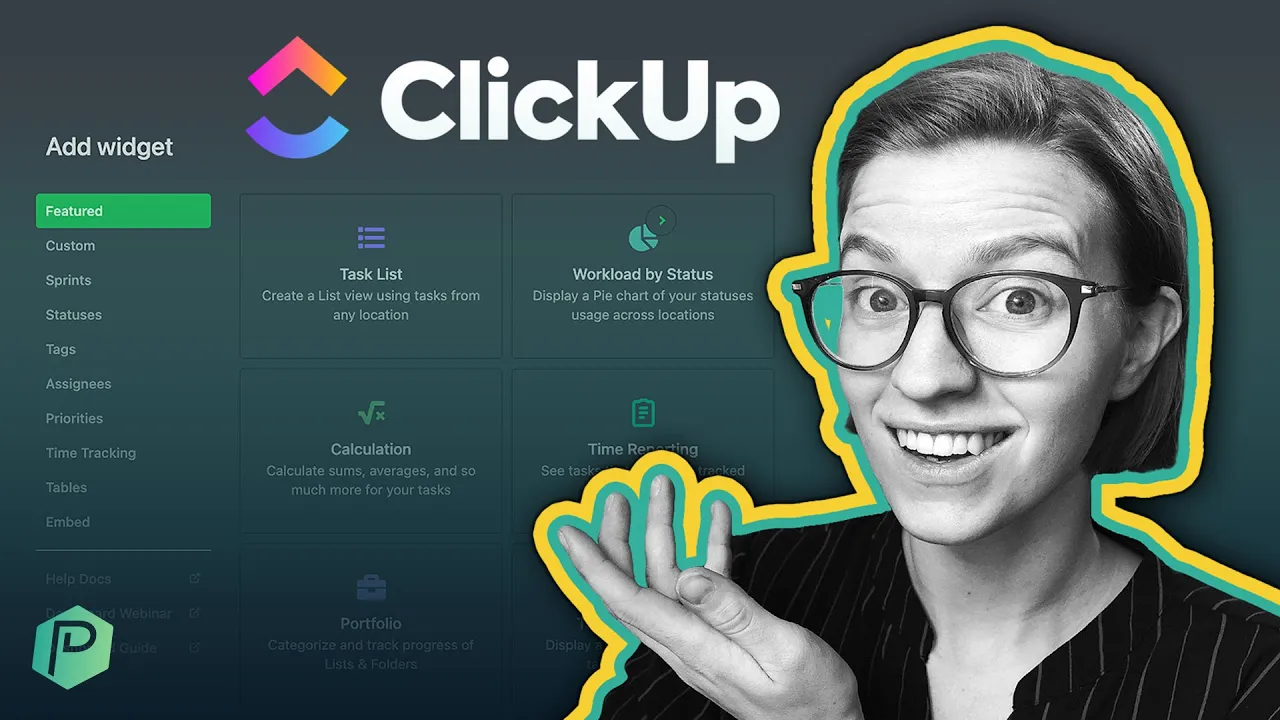
We'll show you how to add widgets to a ClickUp Dashboard, and how to use multiple widgets to make sure that your team is using ClickUp to optimize your team's workflow.
Let's dive in.
Why a Team Monitoring Dashboard is Important

Once you've implemented ClickUp (or any project management tool) into your business, you're really only at the beginning of your project management journey.
Having a nice, fancy piece of software is great! But once you integrate that software with your team of human beings - you will inevitably run into problems that even the fanciest of software can't avoid.
We're not judging here. The software can only do so much to add to your system without the human aspect. However, as a business owner, it's nice to be able to track and monitor how your team members interact with the software.
Insert: a Team Monitoring Dashboard.
By adding this ClickUp Dashboard, you're giving yourself the opportunity to keep an eye on your team's unassigned tasks, overdue tasks, and missed notifications. This isn't meant to give you the role of the disciplinarian or a place to be obsessively watching your team's workflow. Instead, it gives you the data you need to make sure that your team isn't overloaded, confused about something related to the software, or missing important information.
This specific ClickUp Dashboard example includes 5 widgets:
A Text Widget - to define each widget's purpose, and let us know when we will decide if follow-up action is needed or not needed.
A "Who's Behind?" Table Widget - allowing us to see how many uncleared notifications and overdue tasks each team member has inside your ClickUp Workspace.
A Bar Chart Widget - showing similar data as the Who's Behind Table widget, but providing the overdue tasks component in a way that is (in our opinion) a little more digestible.
A Task List Widget
And a Calculation Widget
How to Add a Text Widget

A Text Widget inside a ClickUp Dashboard is a simple text box that allows you to type whatever you need inside of it.
We're going to use this Text Widget to define each widget's purpose and clearly lay out when follow-up action is needed or not needed.
For example, if 100 missed notifications is your benchmark - put that here.
LAYLA GOES INTO SOME DETAIL ON THE TEXT WIDGET AND HOW IT RELATES TO THE OTHER WIDGETS, STARTING AT 02:14.
How to Add a Who's Behind Table Widget

Inside the Who's Behind Table Widget, you can gather data on each team member's uncleared notifications and overdue tasks. It has the added bonus of being able to see the average or sum of these numbers across your account. While also allowing you to keep an eye on how each member of your team is managing their workload overall.
Layla goes into detail on how she uses this to keep our team here at ProcessDriven on track, starting at 03:11.
How to Add a Bar Chart Widget

In the Bar Chart Widget in this example, the X-axis is set to Assignee and the Y-axis is set to Number of Tasks.
This widget shows data that is very similar to the overdue tasks advantage that the "Who's Behind" Table Widget shows, but with a more visual approach.
Layla explains what her team uses as a benchmark for "too many" overdue tasks and how she addresses that with her team, starting at 05:50.
How to Add a Task List Widget

This widget is probably the most common widget amongst ClickUp users. It allows you to be able to see a list view of whichever tasks are most important to you.
You can choose the location, group by whatever you prefer, and filter the list so it only shows the tasks you consider important, no matter where you are inside your ClickUp account.
(We suggest turning "breadcrumbs" on here. They show you the task location and the task name, which is super helpful!)
Having this Task List widget enabled is helpful in filtering any tasks that do not have a due date. By checking this on a regular basis, you can keep important tasks from falling through the cracks.
Layla dives into how she sets optimum filters for this widget starting at 08:10.
How to Add a Calculation Widget

In this Dashboard example, we add two separate Calculation Widgets.
Calculating the number of tasks per assignee
Calculating the number of tasks without an assignee
LAYLA GOES INTO DETAIL ON HOW TO USE THE CALCULATION WIDGET(S) STARTING AT 09:51.
And that's it! Implementing this ClickUp Dashboard with each of these 5 widgets can be very helpful in getting your team on track. And who doesn't love building a system by actually using a software to help you do it?!
Until next time, enjoy the process.
Related Resources
➤ How NOT to Setup ClickUp (4 ClickUp Hierarchy Mistakes)


IF YOU'RE NOT SURE WHERE TO START, TRY